Building a Metrics-Driven PMO: 35 essential KPIs to consider in Project Portfolio Management

What are the metrics and KPIs that a PMO should consider to measure and evaluate the performance of its project portfolios? As a PMO manager, you already know the importance of monitoring the performance of each project to get a quantitative and objective view of the progress, quality, and value delivered by the projects.
But it is not only limited to that. The KPIs and metrics you establish must be connected to the overall business objectives. This is essential for our data analysis processes to be relevant and help you improve your decision making and adopt a culture based on continuous improvement.
What are you going to learn in this post?
- Factors to consider before selecting the metrics to measure.
- A detailed list of 35 metrics and KPIs that every PMO should have on its radar.
- How your performance measurement and evaluation processes can drive the performance of your project portfolios.
- The importance of having a PPM software like Triskell to link the strategic objectives with the KPIs of your PMO.
TABLE OF CONTENTS
- Key factors to consider when deciding the most relevant KPIs for your PMO.
- Project Portfolio Management KPIs and Metrics every PMO should consider.
- How to use Project Portfolio Management KPIs to drive data-driven decision making and continuous improvement.
- Triskell, the all-in-one PPM software to measure all your PMO metrics.
- Conclusion
Key factors to consider when deciding the most relevant KPIs for your PMO
What are the KPIs that I should monitor on a daily basis to evaluate the success of the PMO? Are they also relevant to the organization’s managers and executives? Should these metrics be quantitative only, or also qualitative? And how can this task be made much more productive and not reduced to filling in spreadsheets to which most PMO stakeholders do not have access?
As the PMO manager, you should consider several key factors when deciding your most relevant KPIs and metrics to prove the value you bring to the organization. It is not enough to have the PMO as an administrative office from which to supervise that the different projects are completed within the agreed budgets and deadlines. That vision is now obsolete. Now, the PMO must be a relevant department to drive the organization’s success.
And, in order to prove the value that the PMO brings to the company, you must be very careful when selecting the indicators with which to monitor the performance of your project portfolios.

The PMO cannot be perceived as an administrative office that solely oversees the progress of projects

See the Triskell platform in action in a personal demo
These are the most fundamental aspects that you should take into account when selecting the most relevant KPIs for the PMO:
- Identify your organization’s objectives.
- Be SMART.
- Centralize KPIs in a single source of information.
Identify organizational goals
Before selecting the right KPIs, it is crucial to be clear about your organization’s strategic objectives. This involves understanding the company’s vision, mission and core values.
Aligning the KPIs of the PMO with the overall objectives of the organization will allow you to:
- Establish a direct connection between PMO activities and desired outcomes.
- Focus on measuring and improving the most important aspects of project portfolio management in pursuit of achieving the organization’s objectives.
For example, imagine that your company’s overall goal is to gain a 10 percent market share in the next 2 years. Your PMO, as a result of this objective, can prioritize those metrics that are related to customer satisfaction with the company’s project and product portfolios. And, consequently, establish the CSAT metric as a key performance indicator.
As you see, if you have a vision of the overall objectives of your organization, you will be able to focus on measuring and optimizing those aspects that are key to its success.
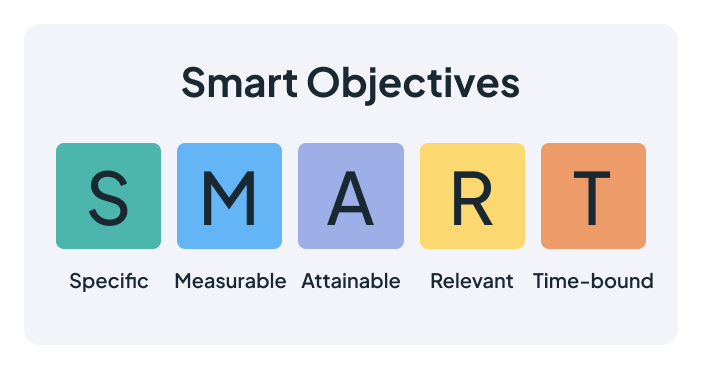
Be SMART
Effective project management is based on setting SMART objectives. That is, the objectives should be:
- Specific
- Measurable
- Achievable
- Relevant
- Time-bound
By applying this approach to the objectives of each project and program managed by the PMO, you can ensure that the KPIs are clear, measurable and oriented towards achieving the overall objectives of the organization.
Some examples of SMART Objectives that can be applied in any Project Management Office would be the following:
- Increase customer satisfaction, as measured by surveys, by 15% by the end of the year.
- Reduce project delivery time by 10% for the next quarter.
- Increase project risk management maturity by implementing a formal risk management process within 6 months.
- Improve project quality by reducing defects by 20% compared to the previous year.
With this SMART approach, KPIs will be clear, measurable and focused on business objectives
See the Triskell platform in action in a personal demo
As you can see, setting SMART goals will provide you with a solid foundation for accurate performance measurement and effective tracking of progress toward established objectives.
Centralize all PMO KPIs in a single source of truth
For efficient KPI management, it is essential to have a single source of information that brings together and visualizes all relevant data from your project and product portfolios. This is where a PPM tool can make a difference.
A tool like this allows you to centralize and consolidate data from projects, programs and portfolios managed by the PMO into one integrated platform. With a complete and up-to-date view of all KPIs, you can make informed decisions based on accurate, real-time data.
Moreover, a PPM software will also make it easier for you to generate reports and effectively communicate results to relevant stakeholders, as you can control who has access to all this information yourself.
Project Portfolio Management KPIs and metrics every PMO should consider
And now, let’s get straight to the point. Surely when you have seen number 35 you might have wondered: is it really necessary to monitor all these metrics? The answer is simple: NO.
And then the next question that will come to your mind will be: how many KPIs should I track? The truth is that there is no clear answer to this question. The number of KPIs you should track will depend on numerous factors, such as:
- Size of the organization.
- The complexity of project portfolios.
- The specific business objectives and needs.
However, when it comes to choosing metrics, keep it simple. It is important to find a balance between the number of KPIs you need in order to obtain a complete view of project portfolio performance without having to overwhelm stakeholders with an excessive number of metrics.
So the number of KPIs you are going to be monitoring is up to you: 5, 8, 10, 12. There is no exact guideline to which you should adhere. Instead, there are a number of best practices that you should follow:
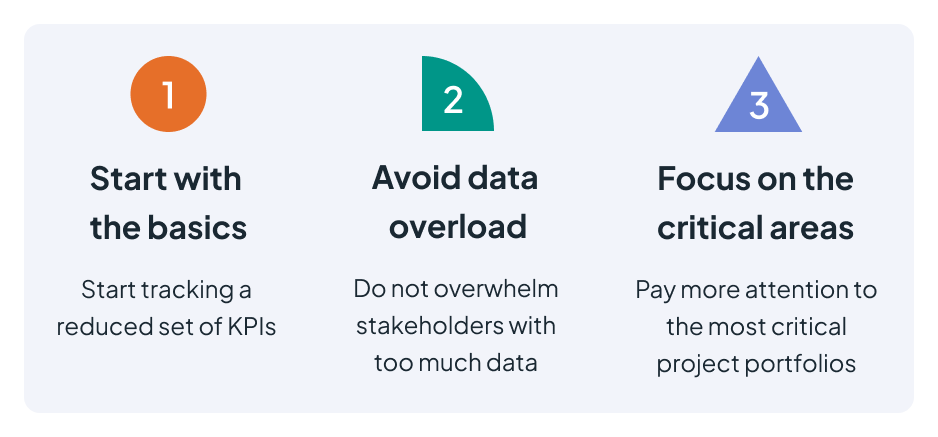
- Start with the basics: whether you are implementing new analytics and data measurement processes in your PMO or refining existing ones, start by monitoring a small set of KPIs. And, as you gain experience, you can gradually expand or refine those KPIs as your needs evolve.
- Avoid information overload: having to keep track of too many KPIs can make you lose focus of the data that is really relevant, and stakeholders may not have clear visibility of the metrics they consider most critical.
- Focus on the most critical areas: identify those areas and project portfolios that have the most significant impact on the business and monitor the most relevant KPIs that give you better visibility into these areas.
So, here are 35 metrics to consider for your PMO. And, depending on the size, complexity and needs of your organization, you should choose a smaller set of KPIs. Here we go!
1. PMOs KPIs to measure schedule and Financial performance
- ROI (Return of Investment): this is a key metric, as it calculates the financial return generated by projects, programs and portfolios compared to the investment made, which will allow you to know the profitability of each of them.
Formula: ROI = (Net Profit / Total Investment) * 100
- Earned Value (EV): it integrates elements such as project scope, timelines and costs to measure the value of the work performed, which helps to evaluate and predict project performance.
Formula: Earned Value (EV) = % of project completed * Planned Budget
- Cost savings: This is a very important metric for enhancing the value of your budget management processes. It represents the cost reductions achieved in the projects compared to the initially established budgets.
Formula: Cost Savings = Planned Budget – Actual Cost
- Cost performance index (CPI): It is an indicator that will help you measure the profitability of projects in terms of how their budget is used. It compares the value of the work performed with the actual costs incurred, indicating whether the project is over or under budget.
Formula: CPI = Earned Value (EV) / Actual Cost (AC)
- Schedule variance (SV): how many projects are on schedule and how many are not? This metric will help you to monitor not only that projects are completed on schedule, but to identify potential bottlenecks and risks related to the project schedule.
Formula: Schedule Variance = Earned Value (EV) – Planned value (PV)
- Cost variance (CV): how many projects have not met the initially agreed costs? This metric shows the difference between earned value and actual project costs, and will help you manage adherence to project costs and identify cost-related issues.
Formula: Cost Variance (CV) = Earned Value (EV) – Actual Cost (AC)
- Budget variance (BV): this is another metric that will help you manage project portfolios finances and identify budget related challenges. It compares budgeted costs to actual costs to determine the budget variance.
Formula: Budget Variance (BV) = Planned Budget – Actual Cost (AC)
If the cost variance or budget variance is negative, it means that the projects have exceeded costs and/or budget
- Benefit Cost Ratio: this KPI measures the financial effectiveness and feasibility of a project by comparing the costs incurred with the anticipated benefits gained. It helps determine whether the financial investment in a project is justified and provides insights into the project’s profitability and value.
Formula: Cost Benefit Ratio = Total Anticipated Benefits / Total Project Costs
- Expected monetary value (EMV): more than a metric, it is a technique for assessing the financial impact that a risk or unforeseen event may have on projects. It involves assigning a monetary value to each possible outcome of a risk event and calculating the expected value based on the probabilities of occurrence.
Formula: EMV = Probability x Impact
To clarify, this formula consists of a 3-step process:
- Assess the probability of an outcome to occur.
- Calculate the monetary value or impact of the outcome.
- Then multiple Probability and Impact to calculate the Expected monetary value.
- Benefits realization rate: This KPI measures the extent to which the expected benefits of a project or initiative have actually been achieved. It compares the expected benefits with the actual benefits achieved and calculates the percentage of benefits that have been realized.
Formula: Benefits Realization Rate = (Actual Benefits / Expected Benefits) * 100

2. KPIs for Resource Management
- Resource Utilization rate: It measures the efficiency of resource allocation and utilization to ensure optimal use of them and identify gaps and areas for improvement.
Formula: Resource utilization Rate = (Actual Work Hours / Available Work Hours) * 100
- Resource cost variance (RCV): unlike the ‘Cost Variance’ metric, this one focus only on resource costs. It measures the deviation between the planned cost and the actual cost of the resources used in the projects. Therefore, it will help you assess whether or not the budget allocated to project resources has been exceeded.
Formula: Resource cost variance = Actual Resource Cost – Planned Resource Cost
- Resource effort variance (REV): similar to the previous one, but in this case what is measured is the difference between the number of hours planned for each project and the actual hours spent. It will provide you insights into whether projects are on track in terms of resource allocation and usage.
Formula: Resource cost variance = Actual Resource Cost – Planned Resource Cost
- Resource Profitability: It evaluates the efficiency and effectiveness of resource usage in generating revenue or adding value to the organization. It helps to assess the financial impact of resource allocation decisions and to optimize their use for better results.
Formula: Resource Profitability = (Revenue Generated or Value Delivered by Resources – Cost of Resources) / Cost of Resources * 100
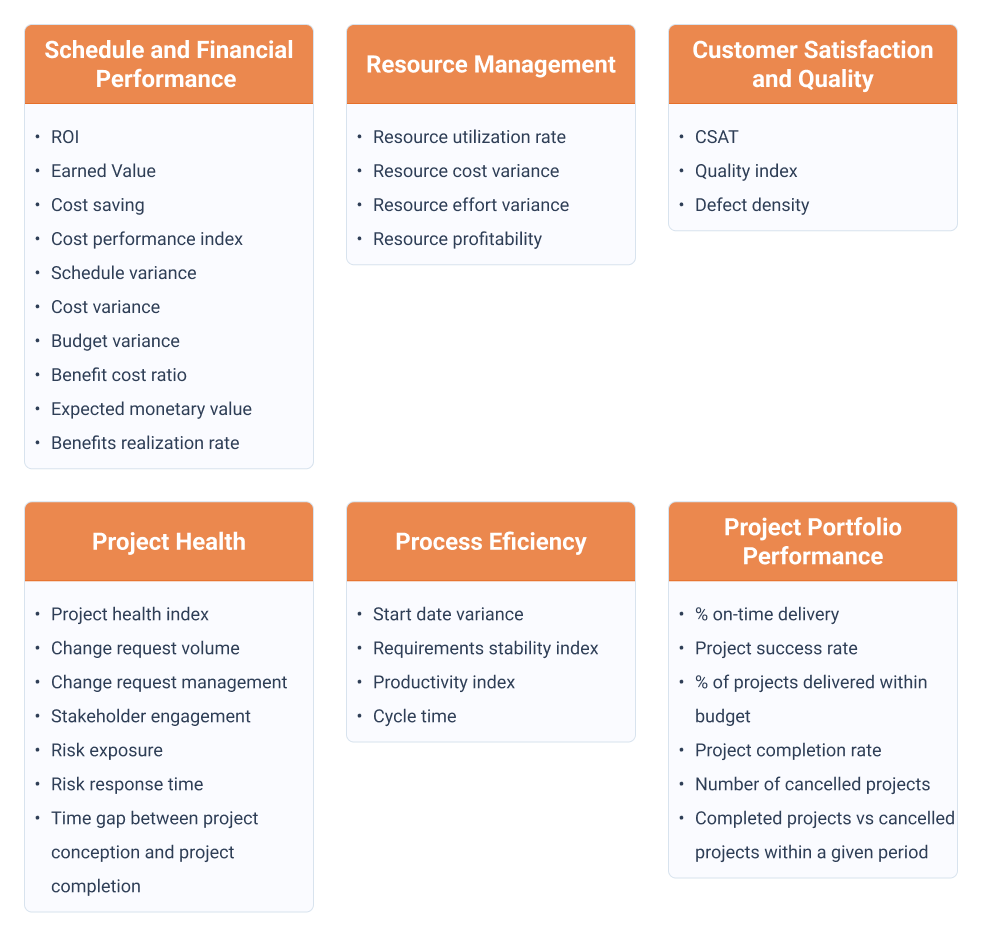
3. PMO KPIs for Customer Satisfaction and Quality
- Customer satisfaction (CSAT): It is an essential metric for assessing the satisfaction level of customers and stakeholders with the results of your project portfolios. It is obtained from surveys.
Fórmula: CSAT = (Total Sum of Scores / Total Number of Responses) * 100
- Quality index: It evaluates the overall quality of project deliverables based on predefined quality criteria. This way you can ensure that the processes and quality standards established by the PMO are met.
There is no global formula for this metric. The result of this metric will depend on how you measure quality in your organization.
- Defect density: it analyzes the number of defects or errors found in the project deliverables (e.g., defective lines of code in a software). Moreover, it provides you with insights into the quality of the product and the effectiveness of defect management.
Formula: Defect density = Number of defects / Size of the deliverable
If the cost variance or budget variance is negative, it means that the projects have exceeded costs and/or budget
4. KPIs for Project Health and Performance
- Project Health index: this metric will provide you with a holistic view of project health based on multiple factors. Broadly speaking, it will help you identify risks, areas for improvement and the overall status of each project.
It is an indicator that combines multiple metrics, such as Earned Value, Budget Variance or Risk Exposure.
- Change request volume: It tracks the number of change requests submitted, approved and delivered. This will give you visibility into changes in project scope and change management effectiveness.
Formula: It is calculated as the sum of the number of change requests received in a given period of time.
- Change Request Management: if you need to measure the level of efficiency of your change management processes, you should take this KPI into account. It assesses factors such as the number of change requests, response times and the ability to evaluate and incorporate changes while minimizing disruptions.
Formula: Change Request Management = (Number of change requests successfully implemented / Total number of change requests) * 100
- Stakeholder engagement: It serves to measure the degree of commitment and collaboration with project stakeholders, and thus ensure the levels of communication, support and alignment that each project requires.
As with Customer Satisfaction, this metric is obtained through surveys or direct feedback from stakeholders.
- Risk exposure: It is a qualitative indicator with which you will be able to evaluate the risk exposure of each project. It will help you identify, quantify and mitigate potential risks.
It’s usually assessed based on the risks identified and their potential impact on the project.
- Risk response time: this metric will give you visibility on the average response and resolution time of detected risks.
Formula: Risk Response Time = (Time of Risk Identification) – (Time of Risk Response Initiation)
5. KPIs to measure Process and Efficiency
- Start date variance (SDV): this metric will give you visibility on possible deviations between the planned start dates and the actual start dates of the projects or their tasks. It will help you assess whether projects are starting on schedule and identify dependencies between projects and even bottlenecks.
Fórmula: Start Date Variance (SDV) = Actual Start Date – Planned Start Date
- Requirements Stability index: this indicator will give you an overview of the stability or volatility of the project requirements. It will give you insights to optimize your change management processes and avoid deviations in project scope.
Fórmula: Requirements Stability Index = (Number of Stable Requirements – Number of Volatile Requirements) / Total Number of Requirements
- Productivity Index: if productivity is emphasized in your organization, this metric should be taken into account. It measures the productivity and efficiency of teams and individuals involved in projects. This indicator will help you optimize resource allocation and improve performance.
Formula: Productivity Index = (Earned Value (EV) / Actual Cost (AC)) * 100
- Cycle time: This metric of the Lean methodology is very useful for improving efficiency and your continuous improvement processes. It calculates the time it takes to complete a specific process or task of a project.
Formula: Cycle Time = (End time of the process/task – Start time of the process/task)

6. PMO KPIs to measure Project and Portfolio performance
- % On-time delivery: This indicator is still basic for any PMO today, as it will give you insights into the efficiency of your processes for the execution of projects within the established deadlines. It basically measures the average time it takes to deliver projects from initiation to completion.
Formula: % On-time Delivery = (Number of Projects Completed on Time / Total Number of Projects) * 100
- Project Success Rate: this metric will provide you with an analysis of the percentage of projects that achieve the established objectives and meet stakeholder expectations. It takes into account various factors such as scope, quality, customer satisfaction, budgets and project timelines. A high project success rate will be a clear indicator of the efficiency of your PMO processes.
Formula: Project Success Rate = (Number of Successful Projects / Total Number of Projects) * 100
- Percentage of projects delivered within budget: It evaluates the percentage of projects that have been completed within the agreed budgets. Indicates the cost control and financial management capability of the PMO in executing projects within the allocated funds.
Formula: Percentage of Projects Delivered Within Budget = (Number of Projects Delivered within Budget / Total Number of Projects) * 100
- Project completion rate: In parallel to the last 3 metrics, you will also find it useful to measure this indicator in order to assess your organization’s ability to deliver projects on time and within scope. It measures the percentage of projects successfully completed within the agreed deadlines.
Formula: Project Completion Rate = (Number of Completed Projects / Total Number of Projects) * 100
Set realistic targets for each KPI based on historical data, benchmarks, and organization’s capabilities
- Number of cancelled projects: This KPI will provide you with insights into the stability of your project portfolios and the effectiveness of your selection and project initiation processes. As a result, you will be able to assess the frequency and reasons for project cancellations, and then take appropriate measures to improve the success rate of your projects.
- Completed projects vs canceled projects within a given period: a complementary metric to the previous one, as it will give you information on the efficiency of PMO processes and opportunities for continuous improvement.
Formula: (Number of Completed Projects / (Number of Completed Projects + Number of Canceled Projects)) * 100
- Time gap between project proposal and project activation: it measures the duration of time lapse between project the submission of a project idea and the actual initiation of the project. This KPI will provide you insights into the efficiency of your Demand Management processes.
It can be calculated by subtracting the date of project activation from the date of project proposal submission.
- Time gap between project conception and project completion: is a complementary metric to the previous one, except that in this case it will give you greater visibility on the efficiency of the execution and delivery of each project.
It is calculated in the same way as the previous one, subtracting the project completion date from the project conception date.
How to use Project Portfolio Management KPIs to drive data-driven decision making and continuous improvement
You’ve decided what metrics to measure. You also have tools that allow you to set up dashboards and reports to inform executives and all stakeholders in the organization about the performance of your project portfolios. Now what?
Another purpose of data analytics is to improve your internal decision-making processes and drive continuous improvement of your PPM processes. This approach will help you improve all PMO management processes.
Analyze the data to gain insights into performance trends, strengths, weaknesses, and potential areas for improvement
Here are some examples of how PMOs can benefit from data analytics:
- Assess the health of project portfolios: by measuring project success rate, resource utilization, budget and schedule adherence, or customer satisfaction, you can identify areas of improvement and take corrective actions to improve the performance of your project portfolios.
- Optimize Resource Management: by analyzing resource management data, you will be able to identify bottlenecks, skills gaps, or the over- or under-utilization of resources. This will enable you to make informed decisions on resource allocation, identify skill needs and ensure that the right resources are allocated to the right projects at the right time.
- Risk analysis and mitigation: By integrating KPIs related to risk management into your analytics processes, you will be able to identify recurring risks and develop risk models to predict and prevent potential problems.
- ROI and benefits analysis: By defining and measuring KPIs related to project objectives and expected benefits, you will be able to assess the real value delivered by each project or program. You will be able to compare projected benefits with realized benefits, identify gaps and take corrective actions to maximize the ROI of project portfolios.
It is calculated in the same way as the previous one, subtracting the project completion date from the project conception date.
Triskell, the all-in-one PPM software to measure all your PMO metrics
We have already mentioned that one of the factors to take into account when selecting the metrics you are going to measure and analyze is to have PPM software that allows you to connect the strategy, execution and KPIs with which you are going to measure the performance of your project portfolios.
Triskell Software is an enterprise portfolio management PPM solution that enables organizations to effectively manage and optimize their project portfolios. Triskell enables real-time monitoring, data-driven decision making and collaboration, and will be your main ally in driving success and achieving your strategic goals.
Why Triskell? Here are 5 compelling reasons why Triskell is the PPM tool any PMO needs:
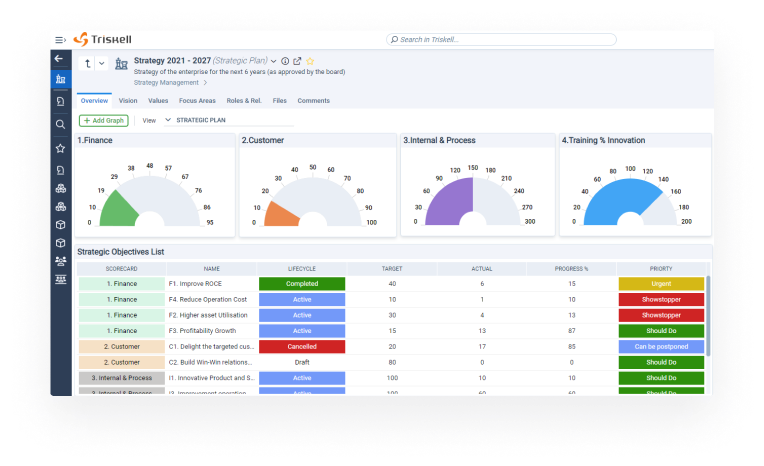
- Strategy and execution in one place: thanks to its strategic planning capabilities, you will be able to evaluate all project requests, analyze whether or not they are aligned with the objectives, and define their KPIs based on your predefined criteria.
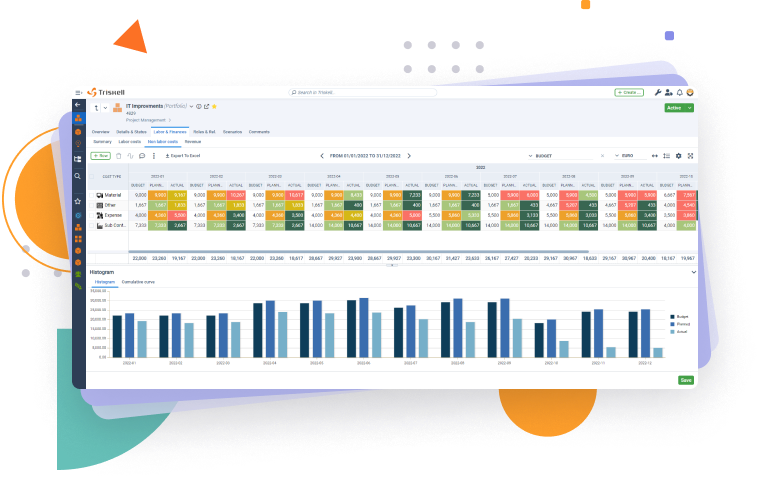
- Centralized data repository: make Triskell your single source for PMO data. You have at your disposal a PPM tool from which to capture and consolidate all project-related information, including plans, financial data, resource allocation and performance metrics.
- Customizable dashboards and reports: with Triskell you can easily customize and create your own dashboards, scorecards and reports to get the necessary visibility on the performance of your project portfolios. In addition, you can automatically export and extract the data to Excel and exploit it there according to your needs.
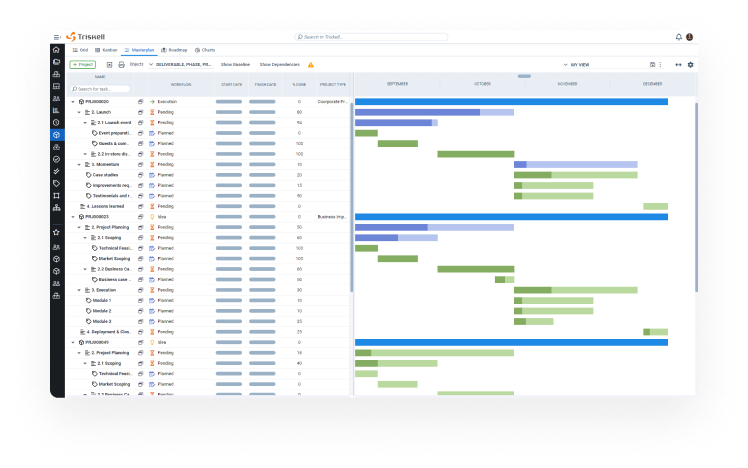
- Real-time performance tracking: Triskell Software solutions cover all aspects of Project Portfolio Planning and Management. With Triskell you will have visibility over Resource Management, Financial Management or Demand Management, which will help you identify problems, trends and areas for improvement.
- Collaboration and communication: Triskell has a set of collaborative tools that facilitate the exchange of information and feedback with teams and stakeholders. This will facilitate transparency, alignment and communication between teams, and the monitoring and management of KPIs by stakeholders.
Conclusion
And we finally come to the end of our journey through the amazing world of PMO metrics and KPIs. As you can see, understanding and properly using this data is essential to the success of the PMO and projects in general. By adopting data-driven management, we can make informed decisions, continuously improve and achieve extraordinary results.
Having a PPM software like Triskell Software will allow you to measure and track all aspects related to your organization’s project portfolios. With Triskell you will be able to prioritize projects and link them to strategic objectives, as well as manage resources, risks and budgets of each project and program efficiently.
Request a demo of Triskell Software
Triskell meets all the requirements for your organization’s PMO to take a step forward in aligning your project portfolio with strategic planning.
FAQs about Project Portfolio Management KPIs and metrics
Are there any industry-standard PMO KPIs?
There isn’t a universally accepted set of PMO KPIs. The best metrics for your organization will depend on your specific goals, industry, and project types. However, as the article points out, there are some general PMO KPIs that are widely used and can be a good starting point. These include metrics like return on investment (ROI), on-time delivery rate, and project health index.
How often should I track and report on PMO KPIs?
The frequency of tracking and reporting on PMO KPIs depends on your needs and the dynamics of your projects. Here’s a general guideline:
- For real-time insights: Track KPIs daily or weekly for projects with critical deadlines or high risks.
- For ongoing monitoring: Track KPIs monthly for projects with standard timelines.
- For strategic decision-making: Compile and report on KPIs quarterly or biannually to assess overall PMO performance and identify trends.
Remember, the key is to find a reporting cadence that provides valuable information without creating information overload.
Is there a difference between PMO KPIs and project metrics?
Yes, there’s a subtle difference between PMO KPIs and project metrics.
- Project metrics are specific, measurable data points that track the progress and performance of individual projects. They focus on aspects like budget adherence, resource utilization, and task completion rates.
- PMO KPIs, on the other hand, measure the effectiveness of the PMO itself. They look at the bigger picture, considering how the PMO’s processes, tools, and methodologies impact project success rates, resource allocation, and overall project portfolio health. PMO KPIs use project metrics as inputs but focus on the PMO’s contribution to project outcomes.
Where can I find more information on PMO KPIs and project portfolio management metrics?
There are many resources available to learn more about PMO KPIs and project portfolio management metrics. Here are a few suggestions:
- Project Management Institutes (PMI): PMI offers a wealth of resources on project management best practices, including guidance on selecting and using KPIs.
- Industry publications: Many industry publications and websites publish articles and reports on PMO best practices and relevant metrics.
- Books and online courses: Several books and online courses delve deeper into PMO KPIs and project portfolio management metrics, providing a more comprehensive understanding.
Related Content

Why the CIO needs a PMO approach
Unlock business success: discover why the CIO must embrace a PMO approach! to elevate efficiency and boost productivity.

Lean Budgeting for Agile Portfolios: A Comprehensive Guide
Lean Budgeting: the financial revolution for Agile portfolios. Discover how to streamline project financing and optimize value delivery.

Implementing SAFe with a 7-step roadmap
Do you want to scale Agile at the enterprise level and don’t know where to start? We solve your doubts by explaining the steps to implement SAFe.